Blockchain technology has emerged as a revolutionary force in the world of digital transactions, offering a decentralized and immutable ledger system that has far-reaching implications across various industries. In this article, we delve into the intricacies of blockchain technology, its applications, architecture, proofs, security measures, and much more.
Understanding Blockchain Technology
At its core, blockchain is a distributed database or decentralized ledger that records transactions in the form of numerical data. Unlike traditional technologies that rely on centralized authorities, blockchain operates on a consensus-based algorithm, ensuring that all transactions are transparent, secure, and verifiable. Each block in the blockchain contains a group of transactions, and these blocks are linked together to form a continuous chain.
One notable aspect of blockchain technology is its cryptographic and peer-to-peer nature, which eliminates the need for intermediaries and enhances security. Transactions recorded on the blockchain are immutable, meaning they cannot be altered or tampered with once they are confirmed. This immutable ledger system provides transparency and trust in digital transactions.
Key Differences from Traditional Technology
Blockchain technology offers several advantages over traditional systems. Unlike centralized systems where trust is placed in a central authority, blockchain relies on the consensus of multiple nodes, making it virtually impossible for all nodes to be compromised simultaneously. Additionally, blockchain provides enhanced confidentiality through encryption methods, ensuring that sensitive data remains private while still being openly distributed.
The decentralized nature of blockchain ensures redundancy and disaster recovery, as the system can continue to function even if individual nodes fail. Moreover, blockchain enhances availability by allowing multiple nodes to participate in the network, thereby reducing the risk of system failure.
Importance and Applications
Blockchain technology has a wide range of applications across various industries. From facilitating secure elections in countries like Sierra Leone to ensuring the security and confidentiality of sensitive data, blockchain offers solutions to complex governance and security challenges. It also enables distributed governance models, integrates external services such as miners and notaries, and provides a robust framework for smart contracts.
Despite its numerous benefits, blockchain technology still faces challenges such as scalability issues, energy consumption concerns, and transaction processing delays. However, with ongoing research and development efforts, these challenges are being addressed to unlock the full potential of blockchain technology.
Benefits of Blockchain Technology
The benefits of blockchain technology are manifold. Unlike traditional cloud computing or database systems, blockchain eliminates the need for trust by relying on cryptographic algorithms that can be independently audited. This trustless system ensures that transactions are secure and transparent without the need for intermediaries.
Blockchain technology also offers cost savings by eliminating third-party transaction fees and streamlining processes such as verification, reconciliation, and clearing. Additionally, blockchain provides permanent data storage, high availability, and enhanced security through private key ownership and digital signatures.
Blocks and Blockchain Architecture
Blocks are the building blocks of blockchain technology, containing transaction data, metadata, and a unique identifier known as a hash. These blocks are linked together to form a continuous chain, with each block containing a reference to the previous block’s hash.
Blockchain architecture involves careful planning and configuration of various elements such as permissions, asset issuance, key management, and address formats. Different consensus mechanisms such as Proof of Work (PoW), Proof of Stake (PoS), and Delegated Proof of Stake (DPoS) are used to ensure the security and integrity of the blockchain network.
Security Measures and Proofs
Security is paramount in blockchain technology, and various consensus mechanisms such as PoW, PoS, and DPoS are employed to prevent attacks and ensure the integrity of the network. Additionally, cryptographic methods such as hashing, digital signatures, and Merkle trees are used to secure transactions and prevent fraud.
Conclusion
In conclusion, blockchain technology holds immense potential to transform various industries by providing secure, transparent, and decentralized solutions to complex problems. With ongoing advancements and innovations, blockchain is poised to revolutionize the way we conduct digital transactions and manage data in the future. As we continue to explore the possibilities of blockchain technology, it is essential to address the challenges and harness its benefits to create a more secure and efficient digital ecosystem.
The Federal Reserve and the United States government are pumping extreme amounts of money into the economy, already totaling over $484 billion. They are doing so because it already had a goal to inflate the United States Dollar (USD) so that the market can continue to all-time highs. It has always had this goal. They do not care how much inflation goes up by now as we are going into a depression with the potential to totally crash the US economy forever. They believe the only way to save the market from going to zero or negative values is to inflate it so much that it cannot possibly crash that low. Even if the market does not dip that low, inflation serves the interest of powerful people.
The impending crash of the stock market has ramifications for Bitcoin, as, though there is no direct ongoing-correlation between the two, major movements in traditional markets will necessarily affect Bitcoin. According to the Blockchain Center’s Cryptocurrency Correlation Tool, Bitcoin is not correlated with the stock market. However, when major market movements occur, they send ripples throughout the financial ecosystem which necessary affect even ordinarily uncorrelated assets.
Therefore, Bitcoin will reach X price on X date after crashing to a price of X by X date.
Stock Market Crash
The Federal Reserve has caused some serious consternation with their release of ridiculous amounts of money in an attempt to buoy the economy. At face value, it does not seem to have any rationale or logic behind it other than keeping the economy afloat long enough for individuals to profit financially and politically. However, there is an underlying basis to what is going on which is important to understand in order to profit financially.
All markets are functionally price probing systems. They constantly undergo a price-discovery process. In a fiat system, money is an illusory and a fundamentally synthetic instrument with no intrinsic value – similar to Bitcoin. The primary difference between Bitcoin is the underlying technology which provides a slew of benefits that fiat does not. Fiat, however, has an advantage in being able to have the support of powerful nation-states which can use their might to insure the currency’s prosperity.
Traditional stock markets are composed of indices (pl. of index). Indices are non-trading market instruments which are essentially summaries of business values which comprise them. They are continuously recalculated throughout a trading day, and sometimes reflected through tradable instruments such as Exchange Traded Funds or Futures. Indices are weighted by market capitalizations of various businesses.
Price theory essentially states that when a market fails to take out a new low in a given range, it will have an objective to take out the high. When a market fails to take out a new high, it has an objective to make a new low. This is why price-time charts go up and down, as it does this on a second-by-second, minute-by-minute, day-by-day, and even century-by-century basis. Therefore, market indices will always return to some type of bull market as, once a true low is formed, the market will have a price objective to take out a new high outside of its’ given range – which is an all-time high. Instruments can only functionally fall to zero, whereas they can grow infinitely.
So, why inflate the economy so much?
Deflation is disastrous for central banks and markets as it raises the possibility of producing an overall price objective of zero or negative values. Therefore, under a fractional reserve system with a fiat currency managed by a central bank – the goal of the central bank is to depreciate the currency. The dollar is manipulated constantly with the intention of depreciating its’ value.
Central banks have a goal of continued inflated fiat values. They tend to ordinarily contain it at less than ten percent (10%) per annum in order for the psyche of the general populace to slowly adjust price increases. As such, the markets are divorced from any other logic. Economic policy is the maintenance of human egos, not catering to fundamental analysis. Gross Domestic Product (GDP) growth is well-known not to be a measure of actual growth or output. It is a measure of increase in dollars processed. Banks seek to produce raising numbers which make society feel like it is growing economically, making people optimistic. To do so, the currency is inflated, though inflation itself does not actually increase growth. When society is optimistic, it spends and engages in business – resulting in actual growth. It also encourages people to take on credit and debts, creating more fictional fiat.
Inflation is necessary for markets to continue to reach new heights, generating positive emotional responses from the populace, encouraging spending, encouraging debt intake, further inflating the currency, and increasing the sale of government bonds. The fiat system only survives by generating more imaginary money on a regular basis.
Bitcoin investors may profit from this by realizing that stock investors as a whole always stand to profit from the market so long as it is managed by a central bank and does not collapse entirely. If those elements are filled, it has an unending price objective to raise to new heights. It also allows us to realize that this response indicates that the higher-ups believe that the economy could crash in entirety, and it may be wise for investors to have multiple well-thought-out exit strategies.
Economic Analysis of Bitcoin
The reason why the Fed is so aggressively inflating the economy is due to fears that it will collapse forever or never rebound. As such, coupled with a global depression, a huge demand will appear for a reserve currency which is fundamentally different than the previous system. Bitcoin, though a currency or asset, is also a market. It also undergoes a constant price-probing process. Unlike traditional markets, Bitcoin has the exact opposite goal. Bitcoin seeks to appreciate in value and not depreciate. This has a quite different affect in that Bitcoin could potentially become worthless and have a price objective of zero.
Bitcoin was created in 2008 by a now famous mysterious figure known as Satoshi Nakamoto and its’ open source code was released in 2009. It was the first decentralized cryptocurrency to utilize a novel protocol known as the blockchain. Up to one megabyte of data may be sent with each transaction. It is decentralized, anonymous, transparent, easy to set-up, and provides myriad other benefits. Bitcoin is not backed up by anything other than its’ own technology.
Bitcoin is can never be expected to collapse as a framework, even were it to become worthless. The stock market has the potential to collapse in entirety, whereas, as long as the internet exists, Bitcoin will be a functional system with a self-authenticating framework. That capacity to persist regardless of the actual price of Bitcoin and the deflationary nature of Bitcoin means that it has something which fiat does not – inherent value.
Bitcoin is based on a distributed database known as the “blockchain.” Blockchains are essentially decentralized virtual ledger books, replete with pages known as “blocks.” Each page in a ledger is composed of paragraph entries, which are the actual transactions in the block.
Blockchains store information in the form of numerical transactions, which are just numbers. We can consider these numbers digital assets, such as Bitcoin. The data in a blockchain is immutable and recorded only by consensus-based algorithms. Bitcoin is cryptographic and all transactions are direct, without intermediary, peer-to-peer.
Bitcoin does not require trust in a central bank. It requires trust on the technology behind it, which is open-source and may be evaluated by anyone at any time. Furthermore, it is impossible to manipulate as doing so would require all of the nodes in the network to be hacked at once – unlike the stock market which is manipulated by the government and “Market Makers”. Bitcoin is also private in that, though the ledge is openly distributed, it is encrypted. Bitcoin’s blockchain has one of the greatest redundancy and information disaster recovery systems ever developed.
Bitcoin has a distributed governance model in that it is controlled by its’ users. There is no need to trust a payment processor or bank, or even to pay fees to such entities. There are also no third-party fees for transaction processing. As the ledge is immutable and transparent it is never possible to change it – the data on the blockchain is permanent. The system is not easily susceptible to attacks as it is widely distributed. Furthermore, as users of Bitcoin have their private keys assigned to their transactions, they are virtually impossible to fake. No lengthy verification, reconciliation, nor clearing process exists with Bitcoin.
Bitcoin is based on a proof-of-work algorithm. Every transaction on the network has an associated mathetical “puzzle”. Computers known as miners compete to solve the complex cryptographic hash algorithm that comprises that puzzle. The solution is proof that the miner engaged in sufficient work. The puzzle is known as a nonce, a number used only once. There is only one major nonce at a time and it issues 12.5 Bitcoin. Once it is solved, the fact that the nonce has been solved is made public.
A block is mined on average of once every ten minutes. However, the blockchain checks every 2,016,000 minutes (approximately four years) if 201,600 blocks were mined. If it was faster, it increases difficulty by half, thereby deflating Bitcoin. If it was slower, it decreases, thereby inflating Bitcoin. It will continue to do this until zero Bitcoin are issued, projected at the year 2140. On the twelfth of May, 2020, the blockchain will halve the amount of Bitcoin issued when each nonce is guessed. When Bitcoin was first created, fifty were issued per block as a reward to miners. 6.25 BTC will be issued from that point on once each nonce is solved.
Unlike fiat, Bitcoin is a deflationary currency. As BTC becomes scarcer, demand for it will increase, also raising the price. In this, BTC is similar to gold. It is predictable in its’ output, unlike the USD, as it is based on a programmed supply. We can predict BTC’s deflation and inflation almost exactly, if not exactly. Only 21 million BTC will ever be produced, unless the entire network concedes to change the protocol – which is highly unlikely.
Some of the drawbacks to BTC include congestion. At peak congestion, it may take an entire day to process a Bitcoin transaction as only three to five transactions may be processed per second. Receiving priority on a payment may cost up to the equivalent of twenty dollars ($20). Bitcoin mining consumes enough energy in one day to power a single-family home for an entire week.
Trading or Investing?
The fundamental divide in trading revolves around the question of market structure. Many feel that the market operates totally randomly and its’ behavior cannot be predicted. For the purposes of this article, we will assume that the market has a structure, but that that structure is not perfect. That market structure naturally generates chart patterns as the market records prices in time. In order to determine when the stock market will crash, causing a major decline in BTC price, we will analyze an instrument, an exchange traded fund, which represents an index, as opposed to a particular stock. The price patterns of the various stocks in an index are effectively smoothed out. In doing so, a more technical picture arises. Perhaps the most popular of these is the SPDR S&P Standard and Poor 500 Exchange Traded Fund ($SPY).
In trading, little to no concern is given about value of underlying asset. We are concerned primarily about liquidity and trading ranges, which are the amount of value fluctuating on a short-term basis, as measured by volatility-implied trading ranges. Fundamental analysis plays a role, however markets often do not react to real-world factors in a logical fashion. Therefore, fundamental analysis is more appropriate for long-term investing.
The fundamental derivatives of a chart are time (x-axis) and price (y-axis). The primary technical indicator is price, as everything else is lagging in the past. Price represents current asking price and incorrectly implementing positions based on price is one of the biggest trading errors.
Markets and currencies ordinarily have noise, their tendency to back-and-fill, which must be filtered out for true pattern recognition. That noise does have a utility, however, in allowing traders second chances to enter favorable positions at slightly less favorable entry points. When you have any market with enough liquidity for historical data to record a pattern, then a structure can be divined. The market probes prices as part of an ongoing price-discovery process. Market technicians must sometimes look outside of the technical realm and use visual inspection to ascertain the relevance of certain patterns, using a qualitative eye that recognizes the underlying quantitative nature
Markets and instruments rise slower than they correct, however they rise much more than they fall. In the same vein, instruments can only fall to having no worth, whereas they could theoretically grow infinitely and have continued to grow over time. Money in a fiat system is illusory. It is a fundamentally synthetic instrument which has no intrinsic value. Hence, the recent seemingly illogical fluctuations in the market.
According to trade theory, the unending purpose of a market or instrument is to create and break price ranges according to the laws of supply and demand. We must determine when to trade based on each market inflection point as defined in price and in time as opposed to abandoning the trend (as the contrarian trading in this sub often does). Time and Price symmetry must be used to be in accordance with the trend. When coupled with a favorable risk to reward ratio, the ability to stay in the market for most of the defined time period, and adherence to risk management rules; the trader has a solid methodology for achieving considerable gains.
We will engage in a longer term market-oriented analysis to avoid any time-focused pressure. The Bitcoin market is open twenty-four-hours a day, so trading may be done when the individual is ready, without any pressing need to be constantly alert. Let alone, we can safely project months in advance with relatively high accuracy. Bitcoin is an asset which an individual can both trade and invest, however this article will be focused on trading due to the wide volatility in BTC prices over the short-term.
Technical Indicator Analysis of Bitcoin
Technical indicators are often considered self-fulfilling prophecies due to mass-market psychology gravitating towards certain common numbers yielded from them. They are also often discounted when it comes to BTC. That means a trader must be especially aware of these numbers as they can prognosticate market movements. Often, they are meaningless in the larger picture of things.
Volume – derived from the market itself, it is mostly irrelevant. The major problem with volume for stocks is that the US market open causes tremendous volume surges eradicating any intrinsic volume analysis. This does not occur with BTC, as it is open twenty-four-seven. At major highs and lows, the market is typically anemic. Most traders are not active at terminal discretes (peaks and troughs) because of levels of fear. Volume allows us confidence in time and price symmetry market inflection points, if we observe low volume at a foretold range of values. We can rationalize that an absolute discrete is usually only discovered and anticipated by very few traders. As the general market realizes it, a herd mentality will push the market in the direction favorable to defending it. Volume is also useful for swing trading, as chances for swing’s validity increases if an increase in volume is seen on and after the swing’s activation. Volume is steadily decreasing. Lows and highs are reached when volume is lower.
Therefore, due to the relatively high volume on the 12th of March, we can safely determine that a low for BTC was not reached.
VIX – Volatility Index, this technical indicator indicates level of fear by the amount of options-based “insurance” in portfolios. A low VIX environment, less than 20 for the S&P index, indicates a stable market with a possible uptrend. A high VIX, over 20, indicates a possible downtrend. VIX is essentially useless for BTC as BTC-based options do not exist. It allows us to predict the market low for $SPY, which will have an indirect impact on BTC in the short term, likely leading to the yearly low. However, it is equally important to see how VIX is changing over time, if it is decreasing or increasing, as that indicates increasing or decreasing fear. Low volatility allows high leverage without risk or rest. Occasionally, markets do rise with high VIX.
As VIX is unusually high, in the forties, we can be confident that a downtrend for the S&P 500 is imminent.
RSI (Relative Strength Index): The most important technical indicator, useful for determining highs and lows when time symmetry is not availing itself. Sometimes analysis of RSI can conflict in different time frames, easiest way to use it is when it is at extremes – either under 30 or over 70. Extremes can be used for filtering highs or lows based on time-and-price window calculations. Highly instructive as to major corrective clues and indicative of continued directional movement. Must determine if longer-term RSI values find support at same values as before. It is currently at 73.56.
Secondly, RSI may be used as a high or low filter, to observe the level that short-term RSI reaches in counter-trend corrections. Repetitions based on market movements based on RSI determine how long a trade should be held onto. Once a short term RSI reaches an extreme and stay there, the other RSI’s should gradually reach the same extremes. Once all RSI’s are at extreme highs, a trend confirmation should occur and RSI’s should drop to their midpoint.
Trend Definition Analysis of Bitcoin
Trend definition is highly powerful, cannot be understated. Knowledge of trend logic is enough to be a profitable trader, yet defining a trend is an arduous process. Multiple trends coexist across multiple time frames and across multiple market sectors. Like time structure, it makes the underlying price of the instrument irrelevant. Trend definitions cannot determine the validity of newly formed discretes. Trend becomes apparent when trades based in counter-trend inflection points continue to fail.
Downtrends are defined as an instrument making lower lows and lower highs that are recurrent, additive, qualified swing setups. Downtrends for all instruments are similar, except forex. They are fast and complete much quicker than uptrends. An average downtrend is 18 months, something which we will return to. An uptrend inception occurs when an instrument reaches a point where it fails to make a new low, then that low will be tested. After that, the instrument will either have a deep range retracement or it may take out the low slightly, resulting in a double-bottom. A swing must eventually form.
A simple way to roughly determine trend is to attempt to draw a line from three tops going upwards (uptrend) or a line from three bottoms going downwards (downtrend). It is not possible to correctly draw a downtrend line on the BTC chart, but it is possible to correctly draw an uptrend – indicating that the overall trend is downwards. The only mitigating factor is the impending stock market crash.
Time Symmetry Analysis of Bitcoin
Time is the movement from the past through the present into the future. It is a measurement in quantified intervals. In many ways, our perception of it is a human construct. It is more powerful than price as time may be utilized for a trade regardless of the market inflection point’s price. Were it possible to perfectly understand time, price would be totally irrelevant due to the predictive certainty time affords. Time structure is easier to learn than price, but much more difficult to apply with any accuracy. It is the hardest aspect of trading to learn, but also the most rewarding.
Humans do not have the ability to recognize every time window, however the ability to define market inflection points in terms of time is the single most powerful trading edge. Regardless, price should not be abandoned for time alone. Time structure analysis It is inherently flawed, as such the markets have a fail-safe, which is Price Structure. Even though Time is much more powerful, Price Structure should never be completely ignored. Time is the qualifier for Price and vice versa. Time can fail by tricking traders into counter-trend trading.
Time is a predestined trade quantifier, a filter to slow trades down, as it allows a trader to specifically focus on specific time windows and rest at others. It allows for quantitative measurements to reach deterministic values and is the primary qualifier for trends. Time structure should be utilized before price structure, and it is the primary trade criterion which requires support from price. We can see price structure on a chart, as areas of mathematical support or resistance, but we cannot see time structure.
Time may be used to tell us an exact point in the future where the market will inflect, after Price Theory has been fulfilled. In the present, price objectives based on price theory added to possible future times for market inflection points give us the exact time of market inflection points and price.
Time Structure is repetitions of time or inherent cycles of time, occurring in a methodical way to provide time windows which may be utilized for inflection points. They are not easily recognized and not easily defined by a price chart as measuring and observing time is very exact. Time structure is not a science, yet it does require precise measurements. Nothing is certain or definite. The critical question must be if a particular approach to time structure is currently lucrative or not.
We will measure it in intervals of 180 bars. Our goal is to determine time windows, when the market will react and when we should pay the most attention. By using time repetitions, the fact that market inflection points occurred at some point in the past and should, therefore, reoccur at some point in the future, we should obtain confidence as to when SPY will reach a market inflection point. Time repetitions are essentially the market’s memory. However, simply measuring the time between two points then trying to extrapolate into the future does not work. Measuring time is not the same as defining time repetitions. We will evaluate past sessions for market inflection points, whether discretes, qualified swings, or intra-range. Then records the times that the market has made highs or lows in a comparable time period to the future one seeks to trade in.
What follows is a time Histogram – A grouping of times which appear close together, then segregated based on that closeness. Time is aligned into combined histogram of repetitions and cycles, however cycles are irrelevant on a daily basis. If trading on an hourly basis, do not use hours.
Daily Lows Mode for those Months: 1, 1, 2, 4, 12, 17, 18, 24, 25, 28, 29, 30
Hourly Lows Mode for those Months (Military time): 0100, 0200, 0200, 0400, 0700, 0700, 0800, 1200, 1200, 1700, 2000, 2200
Minute Lows Mode for those Months: 00, 00, 00, 00, 00, 00, 09, 09, 59, 59, 59, 59
Day of the Week Lows (last twenty-six weeks):
Weighted Times are repetitions which appears multiple times within the same list, observed and accentuated once divided into relevant sections of the histogram. They are important in the presently defined trading time period and are similar to a mathematical mode with respect to a series. Phased times are essentially periodical patterns in histograms, though they do not guarantee inflection points
Evaluating the yearly lows, we see that BTC tends to have its lows primarily at the beginning of every year, with a possibility of it being at the end of the year. Following the same methodology, we get the middle of the month as the likeliest day. However, evaluating the monthly lows for the past year, the beginning and end of the month are more likely for lows.
Therefore, we have two primary dates from our histogram.
1/1/21, 1/15/21, and 1/29/21
2:00am, 8:00am, 12:00pm, or 10:00pm
In fact, the high for this year was February the 14th, only thirty days off from our histogram calculations.
The 8.6-Year Armstrong-Princeton Global Economic Confidence model states that 2.15 year intervals occur between corrections, relevant highs and lows. 2.15 years from the all-time peak discrete is February 9, 2020 – a reasonably accurate depiction of the low for this year (which was on 3/12/20). (Taking only the Armstrong model into account, the next high should be Saturday, April 23, 2022). Therefore, the Armstrong model indicates that we have actually bottomed out for the year!
Bear markets cannot exist in perpetuity whereas bull markets can. Bear markets will eventually have price objectives of zero, whereas bull markets can increase to infinity. It can occur for individual market instruments, but not markets as a whole. Since bull markets are defined by low volatility, they also last longer. Once a bull market is indicated, the trader can remain in a long position until a new high is reached, then switch to shorts. The average bear market is eighteen months long, giving us a date of August 19th, 2021 for the end of this bear market – roughly speaking. They cannot be shorter than fifteen months for a central-bank controlled market, which does not apply to Bitcoin. (Otherwise, it would continue until Sunday, September 12, 2021.) However, we should expect Bitcoin to experience its’ exponential growth after the stock market re-enters a bull market.
Terry Laundy’s T-Theory implemented by measuring the time of an indicator from peak to trough, then using that to define a future time window. It is similar to an head-and-shoulders pattern in that it is the process of forming the right side from a synthetic technical indicator. If the indicator is making continued lows, then time is recalculated for defining the right side of the T. The date of the market inflection point may be a price or indicator inflection date, so it is not always exactly useful. It is better to make us aware of possible market inflection points, clustered with other data. It gives us an RSI low of May, 9th 2020.
The Bradley Cycle is coupled with volatility allows start dates for campaigns or put options as insurance in portfolios for stocks. However, it is also useful for predicting market moves instead of terminal dates for discretes. Using dates which correspond to discretes, we can see how those dates correspond with changes in VIX.
Therefore, our timeline looks like:
2/14/20 – yearly high ($10372 USD)
3/12/20 – yearly low thus far ($3858 USD)
4/1-30/ – ABC Swing Completion and Retracement (to a maximum of $8000)
5/20/20 – T-Theory true yearly low (BTC between 4863 and 3569)
11/26/21 – eighteen months from halvening, average peak from halvenings (BTC begins rising from $3000 area to above $23,312)
4/23/22 – all-time high
Price Symmetry Analysis of Bitcoin
Price symmetry is a quantitative measurement of a deterministic value for price. It is used to determine at what price the market will reach an inflection point based on reactive “price clusters”, derived from laws of supply and demand. Price symmetry is analyzed by continually labeling the market structure for the purpose of predicting possible future inflection points. That price structure may be observed across multiple time-frames and will be measured in reactive “price clusters”, derived from laws of supply and demand. The market gyrates purely based on price action. Price symmetry analysis is different than technical analysis which is a lagging mathematical interpretation of data.
The basis of our discussion will rest on the following premise: if an instrument fails to achieve a new high in a range, it must achieve a new low in said range. If an instrument fails to achieve a new low in a range, it must achieve a new high in said range. This is known as range theory.
Price Theory states that markets and instruments seek to yield to one of two price objectives at any time, therefore they are not random. Efficiency occurs at some price level, however price theory does not tell us the exact efficient price, simply the direction of the probable efficient price. When coupled with time structure, gives near certainty to call market inflection points. The price that an instrument or market reaches efficiency is unknown, but the price objective is certainty which indicates that a future price is the present price objective.
Price Patterns are price structure components based on the market’s movements which conform to price objectives. Price Pattern Objectives are possible areas of mathematical support or resistance that may serve as market inflection points. These are possibilities as opposed to price theory objectives which are certain. Inflection points are those levels at which the market finds support or resistance and reverses from a value, commonly misconstrued with pivot points.
Projection Ranges are Predefined by mathematical calculations to determine possible terminal points for continued price action. Mathematical Clusters are average of multiple mathematical support or resistance numbers occurring around the same approximate values. Retracement levels are based on Fibonacci calculations and each level has own nuances and tendencies. Not every retracement bounce leads to successful trades which replace discretes. Fibonnaci levels tend to produce Retracement memory, which is the markets’ tendency to continue having retracements of future ranges equal to retracements of prior ranges which have been expanded.
Projections are quantifiable mathematical support or resistance calculations. Different projection levels exist for different price patterns. They allow us to anticipate when to take profits or anticipate mathematical support/resistance.
o Projection Levels are determined by the formula – PPN(A, B, C) = (PB – PA) * PN + PC
o PN – projection Percentages (61.8%, 100%, 127.2%, 161.8%, 200%, and 261.8)
o A, B, C being the swing points
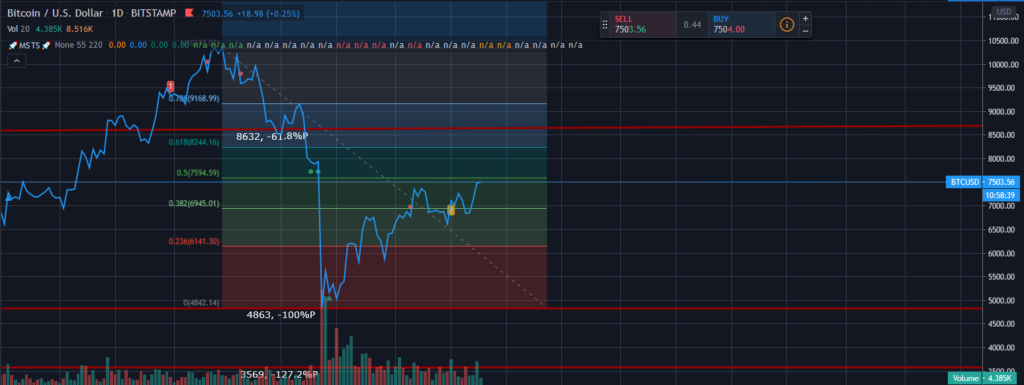
When you plug the numbers into the formula, you will get a variety of projections for BTC. We will evaluate both positive and negative projections. BTC had its low perfectly at the -100%P. At the time of writing, BTC is $7517USD. The closest projection is the 61.8%, also the most well known projection. This projection is only really useful to determine a shallow projection point indicating a later deeper retracement point.
Interestingly enough, this sits at the same value as another swing point on 10/12/2019, as per the light purple lines. This suggests BTC may swing at this price upwards until it reaches a mathematical cluster.
100%P is the most important of all the projection percentages, as instruments will typically encounter some type of support or resistance when reaching it. It could yield either a temporary pullback or a true market inflection point, so price action must be focused on at this level. It is a price pattern objective for all swings.
It is a potential target once any swing activates, but only time will reveal if it is a true terminal point. It is a good area to consider taking partial or total profits, however it may not be a good point to reverse unless an ABC swing is anticipated. This level may be the conclusion of a corrective swing. If 50% holds an instrument, leading to swing activation, then there is a higher probability that 100% will be a true market inflection point. This projection allows us a clue as to whether we are witnessing a true trend change or if a correction inside the previous trend is simply being completed. If this level is breached immediately without much price action occurring, then we can determine that the change in trend indicated by the swing is legitimate. It is the last line of defense for a market’s prior trend.
We could have more confidence in either a -100%P at 4863 or a positive 100%P at 13441 – the most important of all the projection percentages. Instruments will typically encounter some type of support or resistance when reaching it. It could yield either a temporary pullback or a true market inflection point, so price action must be focused on at this level. It is a price pattern objective for all swings. It is a potential target once any swing activates, but only time will reveal if it is a true terminal point.
This level may be the conclusion of a corrective swing. If 50% holds an instrument, leading to swing activation, then there is a higher probability that 100% will be a true market inflection point. This projection allows us a clue as to whether we are witnessing a true trend change or if a correction inside the previous trend is simply being completed.
Therefore, BTC will try to reach a mathematical cluster of $8528, then break downwards between 4863 and 3569.
TC has currently retraced 38.2% of the ABC swing which began this bear market. The 38.2%R is the second most magnetizing retracement as markets will often find price action occurring at this level regardless of whether or not it holds. Most instruments have a reaction at this level. We are approaching the 50%R (BTC 7595).
It leads to change of trend confirmation signals and corrective swing patterns. During this mid-retracement an instrument which has retraced 50% of its’ range has retraced enough such that a swing to new highs out of the range has satisfied one of the requirements of trend change confirmation. If projection levels hold here, the market will reverse below the initial discrete low of original retracement range. A part of future qualification criteria, but not an absolute requirement.
Price theory tells us that the goal is for the market to take out either its high or its low within a range. The negative 100%P for BTC is $4863. Therefore, considering that this is less than half of the possible projections (261.8%P being the max, uncharted territory for the range), it is extremely likely that BTC will not only reach this value but also go lower. Once it reaches this value, the trader should begin purchasing as much as possible as it is now projected to reach all-time highs.
It should be noted that I am no expert by any means, I’m actually quite new to this, it is just an elementary analysis of patterns in price and time. I am not a financial advisor, and this is not advice for a person to enter trades upon.
TL;DR: The Fed is putting so much money into the economy because it already had a goal to inflate it so that the market could go to all-time highs. It has always had this goal. It doesn’t care how much inflation goes up by now because we are going into a depression with the potential to totally crash the US economy forever. It believes the only way to save the market from going to zero or negative values is to inflate it so much that it cannot possibly crash that low. Even if the market does not get that bad, inflation serves the interest of powerful people. We will crash eventually.
—-
The Federal Reserve has caused some serious consternation with their release of ridiculous amounts of money in an attempt to buoy the economy. It does not seem to have any rationale or logic behind it other than keeping the economy afloat long enough for individuals to profit financially and politically. However, there is an underlying basis to what is going on which is important to understand in order to profit from it financially.
The market is a price probing system. It is constantly undergoing a price-discovery process. In a fiat system, money is an illusory and a fundamentally synthetic instrument with no intrinsic value. Markets are composed of indices (pl. of index). Indices are non-trading market instruments which are essentially summaries of business values which comprise them. They are continuously recalculated throughout a trading day, and sometimes indicated as Exchange Traded Funds or Futures. Indices are weighted by market capitalizations of various businesses.
Essentially, when a market fails to take out a new low in a given range, it will have an objective to take out the high. When a market fails to take out a new high, it has an objective to make a new low. This is why price-time charts go up and down, as it does this on a second-by-second, minute-by-minute, day-by-day, and even century-by-century basis. Therefore, market indices will always return to some type of bull market as, once a true low is formed, the market will have a price objective to take out a new high outside of its’ given range – which is an all-time high. INSTRUMENTS CAN ONLY FALL TO ZERO, BUT THEY CAN GROW INFINITELY.
So, why inflate the economy so much?
Deflation is disastrous for central banks and markets as it raises the possibility of producing an overall price objective of zero or negative values. THE PURPOSE OF THE DOLLAR IS TO DEPRECIATE.
Central banks have a goal of continued inflated fiat values. They contain it at less than ten percent (10%) per annum in order for the psyche of the general populace to slowly adjust price increases. As such, THE MARKETS ARE FUNDAMENTALLY DETACHED FROM HUMAN LOGIC. Economic policy is the maintenance of human egos. GDP growth is well-known not to be a measure of actual growth or output. It is a measure of increase in dollars processed. Banks seek to produce raising numbers which make society feel like it is growing economically, making people optimistic. To do so, the currency is inflated, though inflation itself does not actually increase growth. When society is optimistic, it spends and engages in business – resulting in actual growth. It also encourages people to take on credit and debts, creating more fictional fiat.
Inflation is neccesary for markets to continue to reach new heights, generating positive emotional responses from the populace, encouraging spending, encouraging debt intake, further inflating the currency, and increasing the sale of government bonds. THE FIAT SYSTEM CAN ONLY SURVIVE BY CREATING MORE IMAGINARY MONEY ON A REGULAR BASIS.
We profit from this by realizing: investors as a whole always stand to profit from the market so long as: it is managed by a central bank and does not collapse entirely. If those elements are filled, it has an unending price objective to raise to new heights. It also allows us to realize that this response indicates that the higher-ups believe that the economy could crash in entirety, and it may be wise to have multiple well-thought-out exit strategies.
SPY 220p 11/20
This will likely be a multi-part series. It should be noted that I am no expert by any means, I’m actually quite new to this, it is just an elementary analysis of patterns in price and time. I am not a financial advisor, and this is not advice for a person to enter trades upon.
The fundamental divide in trading revolves around the question of market structure. Many feel that the market operates totally randomly and its’ behavior cannot be predicted. For the purposes of this DD, we will assume that the market has a structure, but that that structure is not perfect. That market structure naturally generates chart patterns as the market records prices in time. We will analyze an instrument, an exchange traded fund, which represents an index, as opposed to a particular stock. The price patterns of the various stocks in an index are effectively smoothed out. In doing so, a more technical picture arises. Perhaps the most popular of these is the SPDR S&P Standard and Poor 500 Exchange Traded Fund ($SPY).
In trading, little to no concern is given about value of underlying asset. We concerned primarily about liquidity and trading ranges, which are the amount of value fluctuating on a short-term basis, as measured by volatility-implied trading ranges. Fundamental analysis plays a role, however markets often do not react to real-world factors in a logical fashion. Therefore, fundamental analysis is more appropriate for long-term investing.
The fundamental derivatives of a chart are time (x-axis) and price (y-axis). The primary technical indicator is price, as everything else is lagging in the past. Price represents current asking price and incorrectly implementing positions based on price is one of the biggest trading errors.
Markets ordinarily have noise, their tendency to back-and-fill, which must be filtered out for true pattern recognition. That noise does have a utility, however, in allowing traders second chances to enter favorable positions at slightly less favorable entry points. When you have any market with enough liquidity for historical data to record a pattern, then a structure can be divined. The market probes prices as part of an ongoing price-discovery process. Market technicians must sometimes look outside of the technical realm and use visual inspection to ascertain the relevance of certain patterns, using a qualitative eye that recognizes the underlying quantitative nature
Markets rise slower than they correct, however they rise much more than they fall. In the same vein, instruments can only fall to having no worth, whereas they could theoretically grow infinitely and have continued to grow over time. Money in a fiat system is illusory. It is a fundamentally synthetic instrument which has no intrinsic value. Hence, the recent seemingly illogical fluctuations in the market.
According to trade theory, the unending purpose of a market is to create and break price ranges according to the laws of supply and demand. We must determine when to trade based on each market inflection point as defined in price and in time as opposed to abandoning the trend (as the contrarian trading in this sub often does). Time and Price symmetry must be used to be in accordance with the trend. When coupled with a favorable risk to reward ratio, the ability to stay in the market for most of the defined time period, and adherence to risk management rules; the trader has a solid methodology for achieving considerable gains.
We will engage in a longer term market-oriented analysis to avoid any time-focused pressure. The market is technically open 24-hours a day, so trading may be done when the individual is ready, without any pressing need to be constantly alert. Let alone, we can safely project months in advance with relatively high accuracy.
Some important terms to keep in mind:
§ Discrete – terminal points at the extremes of ranges
§ Secondary Discrete – quantified retracement or correction between two discrete
§ Longs (asset appreciation) and shorts (asset depreciation)
Technical Indicators
– Technical indicators are often considered self-fulfilling prophecies due to mass-market psychology gravitating towards certain common numbers yielded from them. That means a trader must be especially aware of these numbers as they can prognosticate market movements. Often, they are meaningless in the larger picture of things.
§ Volume – derived from the market itself, it is mostly irrelevant. The major problem with volume is that the US market open causes tremendous volume surges eradicating any intrinsic volume analysis. At major highs and lows, the market is typically anemic. Most traders are not active at terminal discretes because of levels of fear. Allows us confidence in time and price symmetry market inflection points, if we observe low volume at a foretold range of values. We can rationalize that an absolute discrete is usually only discovered and anticipated by very few traders. As the general market realizes it, a herd mentality will push the market in the direction favorable to defending it. Volume is also useful for swing trading, as chances for swing’s validity increases if an increase in volume is seen on and after the swing’s activation.
Therefore, due to the relatively high volume on the 23rd of March, we can safely determine that a low WAS NOT reached.
§ VIX – Volatility Index, this technical indicator indicates level of fear by the amount of options-based “insurance” in portfolios. A low VIX environment, less than 20 for the S&P index, indicates a stable market with a possible uptrend. A high VIX, over 20, indicates a possible downtrend. However, it is equally important to see how VIX is changing over time, if it is decreasing or increasing, as that indicates increasing or decreasing fear. Low volatility allows high leverage without risk or rest. Occasionally, markets do rise with high VIX.
As VIX is unusually high, in the forties, we can be confident that a downtrend is imminent.
Trend Definition Analysis
– Trend definition is highly powerful, cannot be understated. Knowledge of trend logic is enough to be a profitable trader, yet defining a trend is an arduous process. Multiple trends coexist across multiple time frames and across multiple market sectors. Like time structure, it makes the underlying price of the instrument irrelevant. Trend definitions cannot determine the validity of newly formed discretes. Trend becomes apparent when trades based in counter-trend inflection points continue to fail.
Downtrends are defined as an instrument making lower lows and lower highs that are recurrent, additive, qualified swing setups. Downtrends for all instruments are similar, except forex. They are fast and complete much quicker than uptrends. An average downtrend is 18 months, something which we will return to. An uptrend inception occurs when an instrument reaches a point where it fails to make a new low, then that low will be tested. After that, the instrument will either have a deep range retracement or it may take out the low slightly, resulting in a double-bottom. A swing must eventually form.
A simple way to roughly determine trend is to attempt to draw a line from three tops going upwards (uptrend) or a line from three bottoms going downwards (downtrend). It is not possible to correctly draw an uptrend line on the SPY chart, but it is possible to correctly draw a downtrend – indicating that the overall trend is downwards.
Time Symmetry
Now that we have determined that the overall trend is downwards, the next issue is the question of when SPY will bottom out.
Time is the movement from the past through the present into the future. It is a measurement in quantified intervals. In many ways, our perception of it is a human construct. It is more powerful than price as time may be utilized for a trade regardless of the market inflection point’s price. Were it possible to perfectly understand time, price would be totally irrelevant due to the predictive certainty time affords. Time structure is easier to learn than price, but much more difficult to apply with any accuracy. It is the hardest aspect of trading to learn, but also the most rewarding.
Humans do not have the ability to recognize every time window, however the ability to define market inflection points in terms of time is the single most powerful trading edge. Regardless, price should not be abandoned for time alone. Time structure analysis It is inherently flawed, as such the markets have a fail-safe, which is Price Structure. Even though Time is much more powerful, Price Structure should never be completely ignored. Time is the qualifier for Price and vice versa. Time can fail by tricking traders into counter-trend trading.
Time is a predestined trade quantifier, a filter to slow trades down, as it allows a trader to specifically focus on specific time windows and rest at others. It allows for quantitative measurements to reach deterministic values and is the primary qualifier for trends. Time structure should be utilized before price structure, and it is the primary trade criterion which requires support from price. We can see price structure on a chart, as areas of mathematical support or resistance, but we cannot see time structure.
Time may be used to tell us an exact point in the future where the market will inflect, after Price Theory has been fulfilled. In the present, price objectives based on price theory added to possible future times for market inflection points give us the exact time of market inflection points and price.
Time Structure is repetitions of time or inherent cycles of time, occurring in a methodical way to provide time windows which may be utilized for inflection points. They are not easily recognized and not easily defined by a price chart as measuring and observing time is very exact. Time structure is not a science, yet it does require precise measurements. Nothing is certain or definite. The critical question must be if a particular approach to time structure is currently lucrative or not.
We will complete our analysis of time by measuring it in intervals of 180 bars. Our goal is to determine time windows, when the market will react and when we should pay the most attention. By using time repetitions, the fact that market inflection points occurred at some point in the past and should, therefore, reoccur at some point in the future, we should obtain confidence as to when SPY will reach a market inflection point. Time repetitions are essentially the market’s memory. However, simply measuring the time between two points then trying to extrapolate into the future does not work. Measuring time is not the same as defining time repetitions. We will evaluate past sessions for market inflection points, whether discretes, qualified swings, or intra-range. Then records the times that the market has made highs or lows in a comparable time period to the future one seeks to trade in.
What follows is a time Histogram – A grouping of times which appear close together, then segregated based on that closeness. Time is aligned into combined histogram of repetitions and cycles, however cycles are irrelevant on a daily basis. If trading on an hourly basis, do not use hours.
Weighted Times are repetitions which appears multiple times within the same list, observed and accentuated once divided into relevant sections of the histogram. They are important in the presently defined trading time period and are similar to a mathematical mode with respect to a series. Phased times are essentially periodical patterns in histograms, though they do not guarantee inflection points*.*
We see that SPY tends to have its lows between three major month clusters: 1-4, primarily March (which has actually occurred already this year), 6-9, averaged out to July, and 10-12, averaged out to November. Following the same methodology, we get the third and tenth days of the month as the likeliest days. However, evaluating the monthly lows for the past year, the end of the month has replaced the average of the tenth. Therefore, we have four primary dates for our histogram.
7/3/20, 7/27/20, and 11/3/20, 11/27/20 .
How do we narrow this group down with any accuracy? Let us average the days together to work with two dates – 7/15/20 and 11/15/20.
The 8.6-Year Armstrong-Princeton Global Economic Confidence model – states that 2.15 year intervals occur between corrections, relevant highs and lows. 2.15 years from the all-time peak discrete is April 14th of 2022. However, we can time-shift to other peaks and troughs to determine a date for this year. If we consider 1/28/2018 as a localized high and apply this model, we get 3/23/20 as a low – strikingly accurate. I have chosen the next localized high, 9/21/2018 to apply the model to. We achieve a date of 11/14/2020.
The average bear market is eighteen months long, giving us a date of August 19th, 2021 for the end of the bear market – roughly speaking.
Therefore, our timeline looks like:
11/14/20 – yearly low (selected from histogram averages, 11/15/20, and the 8.6 Year Confidence model)
7/28/21 – End of bear market (18 month average of 8/9, averaged with histogram date of 7/15)
4/14/22 – lesser correction.
As we move forward in time, our predictions may be less accurate. It is important to keep in mind that this analysis will likely change and become more accurate as we factor in Terry Laundry’s T-Theory, the Bradley Cycle, a more sophisticated analysis of Bull and Bear Market Cycles, the Fundamental Investor Cyclic Approach, and Seasons and Half-Seasons.
I have also assumed that the audience believes in these models, which is not necessary. Anyone with free time may construct histograms and view these time models, determining for themselves what is accurate and what is not. Take a look at 1/28/2008, that localized high, and 2.15 years (1/4th of the sinusoidal wave of the model) later.
The question now is, what prices will SPY reach on 11/14? Where will we be at 7/28? What will happen on 4/14/22?
Edit: We did not inflect at the 61.8%P, so it looks like we are going to at least 286, probably going to continue rising until at least the 22nd of April. If, on the 22nd, it looks like there is any kind of downturn, that could possibly be the peak – taking into consideration time symmetry.
TL;DR –
Time and price symmetry are analysis of general market structure. Coupled with TA, it indicates that we will bottom out for this year on or around November 14th. The price of SPY when we bottom out for this year should be 220.09 or less.
SPY 220p 11/20
– – –
Unfortunately, my last post seemed to be a bit too drawn out to capture the attention of the autists. As such, this one will be more succinct. The last post was on Time Symmetry. This post will describe price symmetry, which is a quantitative measurement of a deterministic value for price. Basically, we want to determine at what price the market will reach an inflection point based on reactive “price clusters”, derived from laws of supply and demand.
The basis of our discussion will rest on the following premise: if an instrument fails to achieve a new high in a range, it must achieve a new low in said range. If an instrument fails to achieve a new low in a range, it must achieve a new high in said range.
o Price Theory – market seeks to yield to one of two price objectives, therefore it is not random. Efficiency occurs at some price level, however price theory does not tell us the exact efficient price, simply the direction of the probable efficient price. When coupled with time structure, gives near certainty to call market inflection points.
· The price that an instrument or market reaches efficiency is unknown, but the price objective is certainty which indicates that a future price is the present price objective.
§ Price Patterns – price structure components is based on the market’s movements which conform to price objectives.
· Price Pattern Objectives – a possible area of mathematical support or resistance that may serve as a market inflection point. opposed to price theory objectives which are certain.
§ Inflection point – a level at which the market finds support or resistance and reverses from a value, commonly misconstrued with pivot points.
§ Projection Range – Predefined by mathematical calculations to determine possible terminal points for continued price action.
§ Mathematical Cluster – average of multiple mathematical support or resistance numbers occurring around the same approximate value.
§ Retracement levels – each level has own nuances and tendencies. Not every retracement bounce leads to successful trades which replace discretes. Must be used with tight stop-losses in order to validate large risk-to-reward ratios.
· Retracement memory – markets tendency to continue having retracements of future ranges equal to retracements of prior ranges which have been expanded
SPY has currently retraced 38.2% of the ABC swing which began this bear market. The 38.2%R is the second most magnetizing retracement, markets will often find price action occurring at this level regardless of whether or not it holds. Most instruments have a reaction at this level.
· Projections – quantifiable mathematical support or resistance calculation, different projection levels exist for different price patterns. Allow us to anticipate when to take profits or anticipate mathematical support/resistance.
o Projection Levels – PPN(A, B, C) = (PB – PA) * PN + PC
o PN – projection Percentages (61.8%, 100%, 127.2%, 161.8%, 200%, and 261.8)
o A, B, C being the swing points
When you plug the numbers into the formula, you will get a variety of projections for SPY. Anyways, SPY right now sits at 275.63. The closest projection is the 61.8%, also the most well known projection. This projection is only really useful to determine a shallow projection point indicating a later deeper retracement point.
Interestingly enough, this sits at the same value as another swing point on 11/1/2018.
However, we could have more confidence in a 100%P – the most important of all the projection percentages, instrument will typically encounter some type of support or resistance when reaching it. It could yield either a temporary pullback or a true market inflection point, so price action must be focused on at this level. It is a price pattern objective for all swings. It is a potential target once any swing activates, but only time will reveal if it is a true terminal point.
This level may be the conclusion of a corrective swing. If 50% holds an instrument, leading to swing activation, then there is a higher probability that 100% will be a true market inflection point. This projection allows us a clue as to whether we are witnessing a true trend change or if a correction inside the previous trend is simply being completed.
Therefore, SPY will either try to reach 100%P, which is 286.25, when break downwards, or, it is possible that the previous swing point coupled with the 61.8%P we have already reached, being in the 38.2%R, could cause us to turn downwards. If the latter is the case, we should see a large downturn tomorrow. Otherwise, I expect we will eventually reach 286.25 over the course of a month or so, then downturn.
So, where will SPY reach mid-November?
Price theory tells us that the goal is for the market to take out either its high or its low within a range. The negative 100%P for SPY is 220.09. Therefore, considering that this is less than half of the possible projections (261.8%P being the max, uncharted territory for the range), it is extremely likely that SPY will not only reach this value but also go significantly lower. Once it reaches 220.09, the trader should take partial profits and begin monitoring it intensely for further action.
Therefore, a wise trader could take puts from the current value on down to 220 with an 11/4 expiry date, selling along the way and capitalizing.
It should be noted that I am no expert by any means, I’m actually quite new to this, it is just an elementary analysis of patterns in price and time. I am not a financial advisor, and this is not advice for a person to enter trades upon.